
How To Fix A Failed Core Web Vitals Assessment In 2026
A Core Web Vitals assessment is Google’s measure of how real visitors experience your site’s loading, interactivity, and visual stability. Your site passes only when at least 75% of real-world page loads hit the “Good” threshold across all three metrics. Fail it, and you’re shipping a slow, janky experience that Google can use as a ranking tiebreaker.
Most sites sit closer to the line than their owners think. As of early 2026, only about 55.7% of web origins pass all three thresholds globally, per HTTP Archive data. Mobile is worse, at 49.7%. If your site just got flagged “Failed” in PageSpeed Insights or Search Console, you’re in the majority.
This piece walks through how to run the test, what a failure actually tells you, and the specific fixes that move each metric. I’ve run these plays on dozens of client sites, and the honest answer is that maybe 20% of the standard advice floating around SEO blogs actually matters.
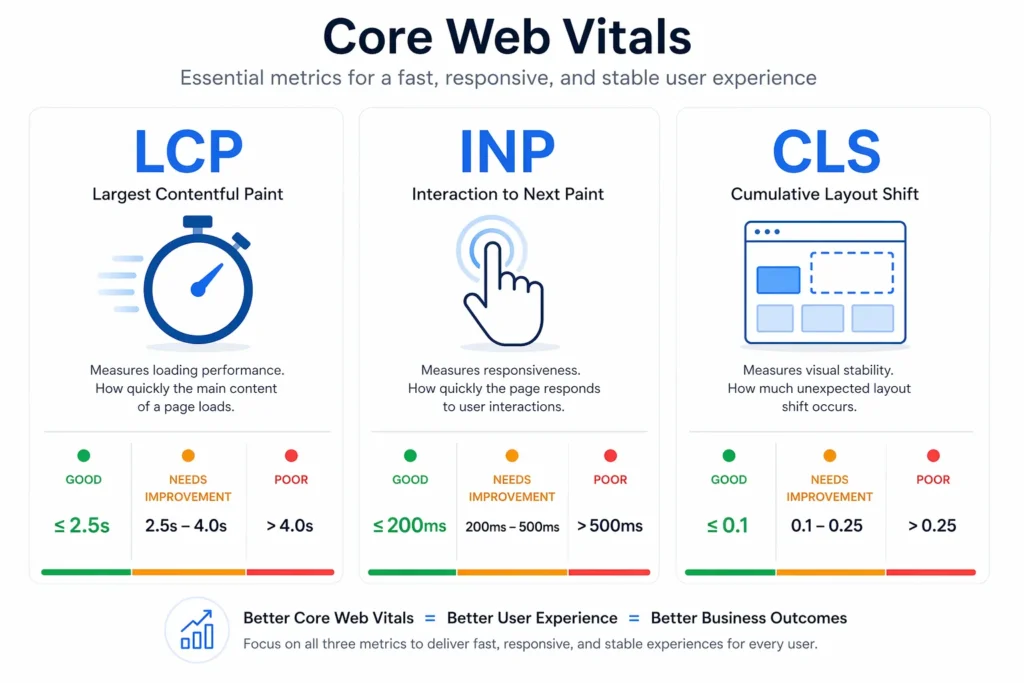
What does a Core Web Vitals assessment measure?
Three things, all captured from real user sessions in the Chrome User Experience Report (CrUX):
| Metric | What it tracks | “Good” threshold |
| Largest Contentful Paint (LCP) | How fast the biggest element loads | ≤ 2.5 seconds |
| Interaction to Next Paint (INP) | How fast the page responds to clicks, taps, and keystrokes | ≤ 200 milliseconds |
| Cumulative Layout Shift (CLS) | How much stuff jumps around while loading | ≤ 0.1 |
INP replaced First Input Delay back in March 2024, so if you’re reading older guides that still mention FID, throw them out. INP is a harder test and catches a lot more responsiveness problems, especially on JavaScript-heavy pages.
Google grades at the 75th percentile. That means 3 out of every 4 visits need to hit “Good” for the metric to pass. One bad metric fails the whole assessment. No partial credit.
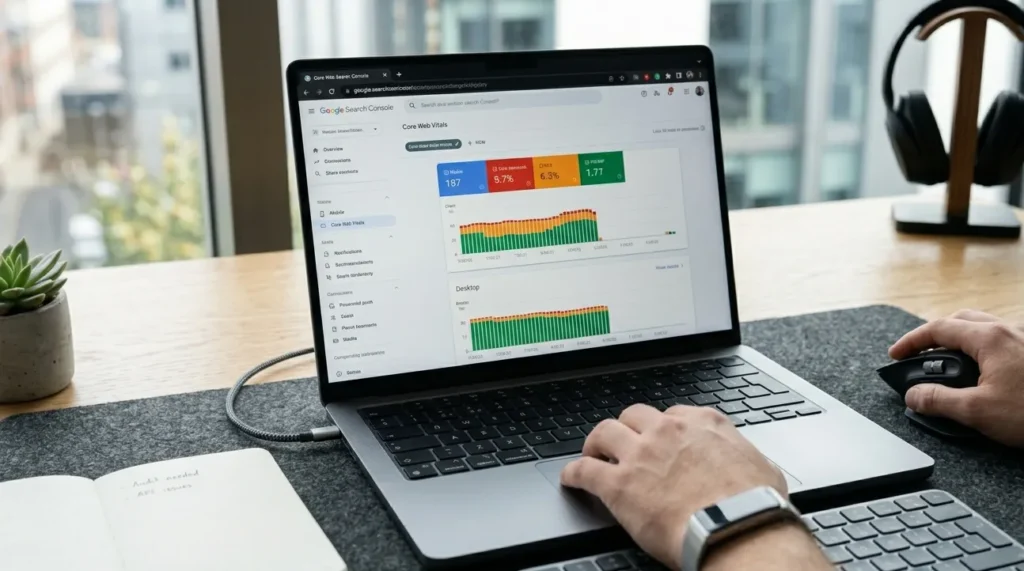
How do you run a Core Web Vitals assessment?
Three free Google tools, each with a different job.
PageSpeed Insights is the fastest option. Paste a URL at pagespeed.web.dev and you’ll see a pass/fail banner under the “Discover what your real users are experiencing” section. This pulls from CrUX, so it reflects real field data, not a simulated test.
Search Console has a dedicated Core Web Vitals report under the Experience menu. This one is better for site-wide diagnosis because it groups URLs by issue. If 400 product pages share a slow LCP, you’ll see them clustered together instead of testing one at a time.
Lighthouse (built into Chrome DevTools) runs a lab test on a single page. Lab data differs from field data, which matters a lot. A page can score 95 in Lighthouse and still fail CrUX because real users on 4-year-old Android phones with 12 browser tabs open hit it harder than a synthetic Chrome instance on a gigabit connection. Don’t trust Lighthouse scores alone.
What happens if your site fails?
You’re delivering a slow, stuttering experience to most of your visitors. That’s the actual problem. The SEO impact is secondary.
Specifically, failure means at least one of these is happening:
- Slow loading: main content takes longer than 2.5 seconds to appear (LCP)
- Sluggish response: clicks and taps lag by more than 200 milliseconds (INP)
- Visual shifting: elements shove around the page after users start reading (CLS)
On rankings, an honest take most CWV guides won’t give you: Core Web Vitals are a tiebreaker, not a top-three ranking factor. Analysis from 2026 shows pages in position 1 are only about 10% more likely to pass CWV than pages in position 9. Good content still wins. What CWV does is let a competitor leapfrog you when content quality is roughly equal and after the March 2026 core update, sites with LCP above 3 seconds saw around 23% more traffic loss versus faster competitors. That’s the real cost.
How do you fix a failed Core Web Vitals assessment?
Go metric by metric. Trying to “improve site speed” in general is how people waste four weeks and move nothing.
1. Find out which metric is actually failing
Pull the Search Console Core Web Vitals report. Note which metric is in the red, and on which template (product pages, blog posts, category pages). Most sites don’t fail everything. They fail one metric on one page type. That’s your focus.
Also check the 28-day trend. If the metric is already improving, a recent fix might be working its way through the CrUX window. Data takes 28 days to fully refresh, so don’t panic-deploy on top of an ongoing fix.
2. How do you fix poor LCP scores?
LCP is the most common failure. Per the 2024 Web Almanac, 73% of mobile pages have an image as their LCP element. Among pages with poor LCP, the image load delay alone accounts for 1,290 milliseconds at the 75th percentile. That’s more than half the entire budget gone before the image even starts downloading.
The fastest wins, in order:
- Make sure your LCP image is in the HTML source. If your hero image loads via JavaScript or a data-src attribute, the browser’s preload scanner can’t find it early. Use a standard <img src=”…”> or srcset.
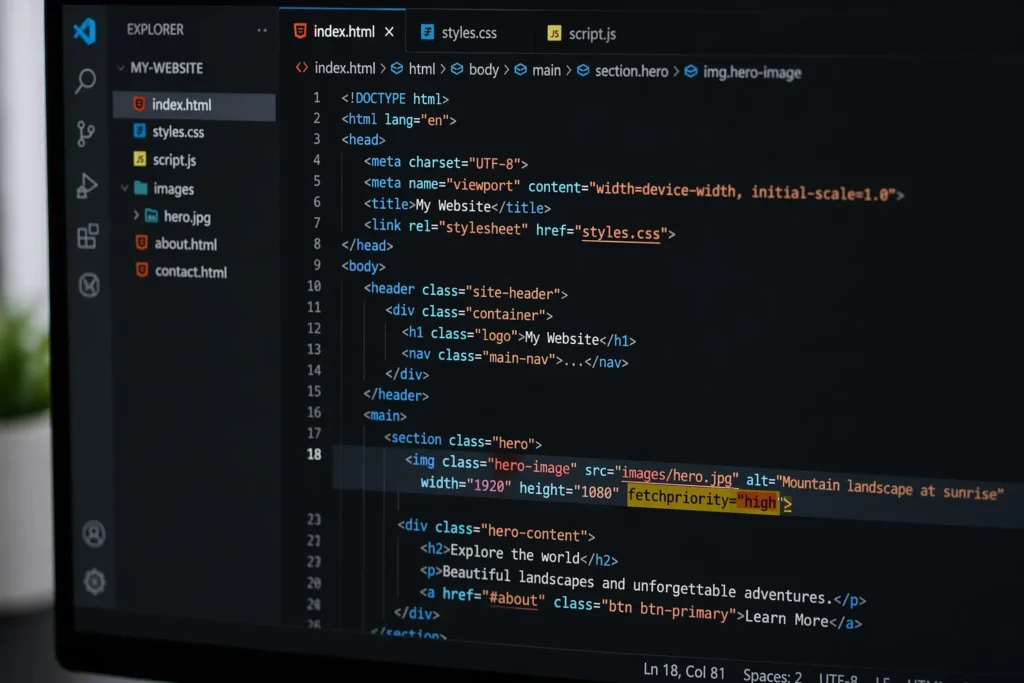
- Add fetchpriority=”high” to the LCP image. This tells the browser to grab it before lower-priority resources. Only 15% of eligible pages use it, per web.dev, so it’s free upside.
- Remove loading=”lazy” from the LCP image. Lazy loading is great for below-the-fold images and a disaster for the hero.
- Serve modern image formats. WebP or AVIF shrink file sizes 30-50% versus JPEG with no visible quality loss.
- Speed up your server. A slow Time to First Byte (TTFB) poisons LCP no matter what you do to the image. A CDN with edge caching often cuts TTFB by 40-70%.
3. How do you fix poor INP scores?
INP failures are almost always JavaScript problems. Third-party tags (analytics, ads, chat widgets, marketing pixels) are the most common INP killers, and the site owner usually has no idea they’re there.
The plays that work:
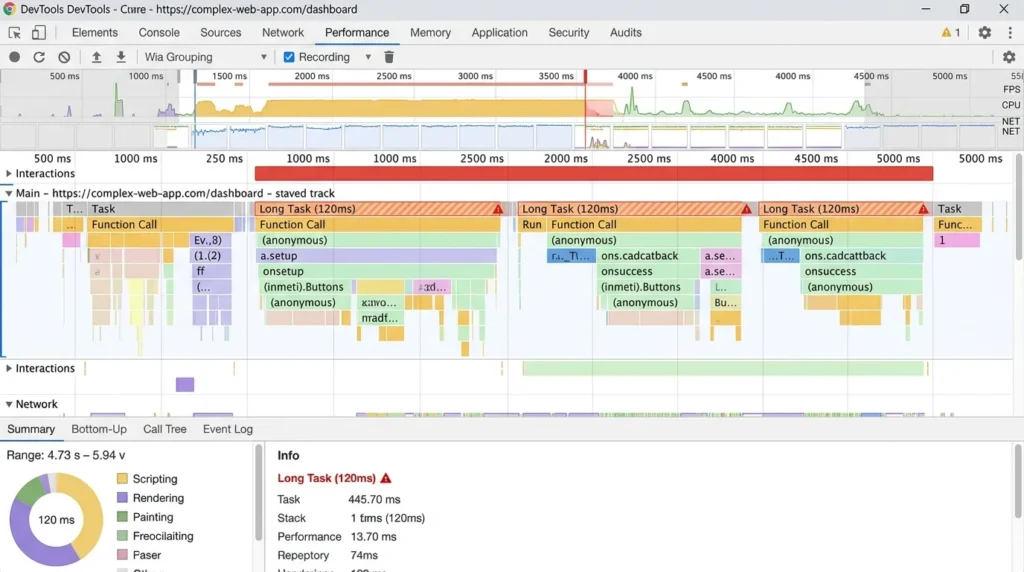
- Audit third-party scripts. Open Chrome DevTools → Performance, record an interaction, look at the main thread. If your “Chat” button takes 800ms to respond because a marketing pixel is blocking, that’s your answer. Drop or defer anything that isn’t pulling its weight.
- Break up long tasks. Any JavaScript task over 50ms blocks the main thread. Use scheduler.yield() or setTimeout to let the browser breathe between chunks.
- Remove unused JavaScript. The Coverage tab in Chrome DevTools shows what’s actually running. Most sites ship 40-60% dead code.
- Move work off the main thread with Web Workers for anything heavy.
4. How do you fix poor CLS scores?
CLS is usually the easiest to fix. Most failures come from four sources:
- Images without width and height attributes. The browser reserves zero space until the image arrives, then shoves everything down.
- Web fonts that flash. Reserve space with font-display: swap and preload critical fonts.
- Banners and ad slots that inject after load. Set explicit dimensions before the content arrives.
- Cookie consent bars at the top. Move them to the bottom or reserve space with CSS.
Add width and height attributes to every image. This alone fixes half of all CLS issues I see in audits. It takes an afternoon.
5. Use field data, not just lab tests
Lab tools like Lighthouse produce a clean score in a controlled environment. Real users don’t get that environment. They’re on older Android phones with spotty Wi-Fi and ten browser tabs fighting for memory.
Always cross-check Lighthouse against Search Console’s field data. When they disagree, the field data is right. This is where real technical SEO audits surface issues that lab-only testing misses. Most misleading “passing” scores come from lab tests that don’t account for how actual mobile traffic hits your site.
What if the assessment says “not applicable”?
A “not applicable” result means Google has partial data for your page but not enough for the three Core Web Vitals. You’ll usually see TTFB, First Contentful Paint, or CLS data present while LCP or INP are missing.
This happens on pages sitting right at the minimum traffic threshold for CrUX reporting. Not every visit logs every metric. A visitor who lands and leaves without clicking won’t contribute an INP measurement, for example.
If your whole site shows “No Data,” you simply don’t have enough Chrome traffic to report. That’s common for newer sites and niche B2B pages. The fix isn’t to panic. Run Lighthouse on your highest-value pages and address issues there.
How do your competitors’ scores stack up?
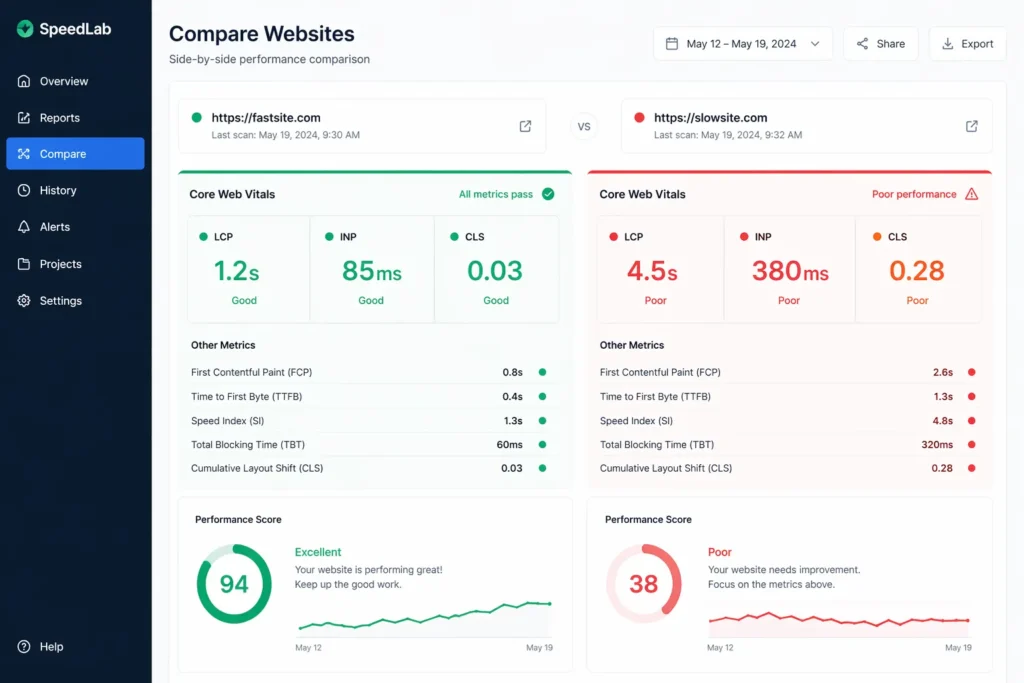
You don’t need to beat everyone. You need to beat the sites ranking above you for queries that matter. Plug your top 3-5 competitors into PageSpeed Insights and note their CrUX scores. If they’re all passing and you’re not, CWV is almost certainly contributing to your ranking gap. If they’re all failing, the gap is somewhere else (usually content or backlinks).
Per Search Engine Journal’s August 2025 analysis, CMS choice matters more than most people admit. Duda led all platforms, with 83.63% of sites passing. WordPress can compete (I’ve seen tuned WordPress sites hit the same numbers), but it takes discipline on themes, plugins, and caching. The bloated off-the-shelf theme is where most sites bleed speed.
Why continuous Core Web Vitals monitoring matters in 2026
CrUX data lags 28 days. Deploy a fix on the 1st and you won’t see the full result until the 28th. That’s too long to fly blind.
Set up two monitoring layers. Lab-based testing (Lighthouse, scheduled) catches regressions the same day code ships. Field monitoring (Search Console checks weekly) confirms the fixes are actually reaching real users. Neither alone is enough. I’ve seen sites celebrate a Lighthouse jump that never materialized in CrUX because the change only helped desktop users on fast networks.
The sites that stay ahead treat the Core Web Vitals assessment as a standing engineering concern, not a one-time audit. Every new feature, every third-party tag, every web design refresh is a potential regression. Catch them early, or catch them in your traffic reports six weeks later.
FAQs
Why does my site pass Lighthouse but fail the Core Web Vitals assessment?
Lighthouse runs a simulated lab test on one page under ideal conditions. The Core Web Vitals assessment uses real user data from the Chrome User Experience Report, captured from actual visitors at the 75th percentile. Real users on older phones, slower networks, and third-party-script-heavy sessions expose problems that lab tests miss. Always trust field data in Search Console over lab scores when they disagree.
How long does it take for Core Web Vitals fixes to show up?
CrUX data updates on a rolling 28-day window, so your Search Console report won’t reflect a fix until roughly a month after deployment. Real ranking effects, if any, typically surface over several additional weeks as Google reprocesses the signals. Fast wins like image dimension fixes can show in user behavior metrics faster, but the official CWV report lags.
Is INP more important than LCP in 2026?
Both count equally failing either one fails the whole assessment. INP replaced First Input Delay in March 2024 and set a harder bar, so more sites struggle with it. On JavaScript-heavy pages with lots of tags and widgets, INP is usually the first to fail. LCP remains the most common failure overall because 73% of mobile pages have an image as their LCP element.
Can a WordPress site pass the Core Web Vitals assessment?
Yes. Per Search Engine Journal’s August 2025 analysis, Duda led all platforms with 83.63% of sites passing CWV, but well-tuned WordPress sites hit the same numbers. The failure pattern for WordPress is predictable: bloated themes, too many plugins, and heavy page builders. Strip those down, add proper caching, serve modern image formats, and most WordPress sites can pass.
Does fixing Core Web Vitals actually improve rankings?
Modestly. CWV functions as a tiebreaker rather than a major ranking booster. 2026 analysis found that pages in position 1 are only about 10% more likely to pass CWV than pages in position 9. Strong content still does the heavy lifting. But after the March 2026 core update, sites with LCP above 3 seconds saw roughly 23% more traffic loss versus faster competitors so poor scores can actively hurt when competition is tight.
What’s the difference between mobile and desktop Core Web Vitals scores?
Mobile consistently lags desktop. As of early 2026, about 49.7% of origins pass all three thresholds on mobile versus 57.1% on desktop. The gap comes from weaker CPUs, slower networks, and variable signal quality on phones. Since Google uses mobile-first indexing, the mobile score is the one that matters for ranking, even if your desktop numbers look great.
What does “Core Web Vitals not applicable” mean?
It means Google has partial CrUX data for your page but not enough for all three Core Web Vitals metrics. You’ll typically see TTFB, First Contentful Paint, or CLS reported while LCP or INP are missing. The cause is usually low traffic volume, your page sits right at the threshold Google needs to report field data reliably. On newer or niche sites, this is normal.

Michael Vale has over 5 years of experience helping clients improve their business visibility on Google. He combines his love for teaching with his entrepreneurial spirit to develop innovative marketing strategies. Inspired by the big AI wave of 2023, Michael Vale now focuses on staying updated with the latest AI tools and techniques. He is committed to using these advancements to deliver great results for his clients, keeping them ahead in the competitive online market.